22 November 2020
In the continuation of our previous article, we will try to determine, at least as a first approximation, the parameters and features that will allow us to conclude if conductor is frauding on selling tickets. First of all, we must note that we a priori don't know how much is each conductor is frauding and, accordingly, it's difficult for us to evaluate what parameters of real statistical distributions of transaction times to pay attention to and what patterns in this time series we must to pay attention to. One of the approaches to solving this issue (at least preliminary) can be simulation modeling of a conductor's work in various modes of operation – with and without fraud – and analysis of this data. With the right choose of a model, it is possible to determine those characteristics in statistics that should be addressed to determine fraud.
As is well known, a good model should preserve the most important features of the phenomenon under study, which faithfully reflect desired characteristics of a studied process. And at the same time, we must throw away all unnecessary from our model, for its maximum simplification. And the question of what to leave and what to throw out is one of the most important in the model preparation process. By and large, it's solved by check of all possible variants - we will try to simplify our model as much as possible and compare the simulation results with the reality. And if they reproduce this reality in the main things, then it's possible, to try to determine the characteristics of fraud and complicate the model in order to more accurately reproduce the real transactions time series.
Let's take the following modeling provisions:
- The bus is represented by a grid of finite size. The conductor and passengers are placed in the nodes of this grid.
- Per unit of model time, a conductor moves to the adjacent node vertically or horizontally. The direction of this movement is determined by a nearest passenger (Chebyshev distance).
- Time between stops is the same.
- The same number of passengers comes from each stop. At the same time, we believe that passengers appear on the grid in the unoccupied grid nodes in a random manner with the same probability for each node.
- When selling a ticket to a passenger, we taking in account, that this process takes some constant time, but also it's different for cash and bank cards (more time for a bank card, since we have an online transactions). How current passenger will be paid (with a bank card or with cash) is decided randomly on the basis of the real percentage of bank cards in transport of a studied city.
- After a ticket is sold to a passenger, we removing this passenger.
- Fraud is modeled as follows: in the case of a cash transaction, it's randomly not recorded in the array of transaction times. This is equivalent to the fact that a ticket from a previous cash transaction, which passenger didn't receive in his hands for some reason, is immediately transferred to a passenger with next cash payment.
Thus, a typical picture of the working field during the simulation is as follows: (Figure 1).
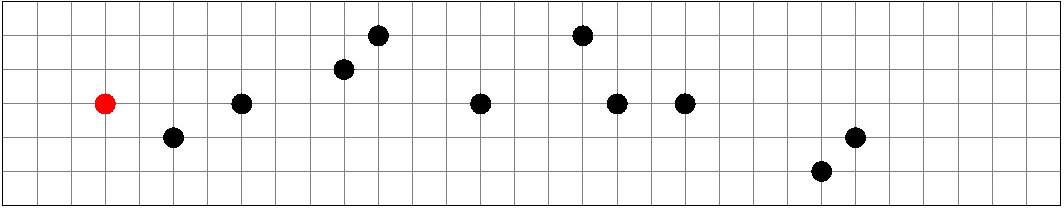
Figure 1.
Real time model operation.
According to the simulation results, an analysis similar to the analysis in our previous work. The following figure shows a typical histogram of the distribution of time between transactions for a model conductor and a trip with parameters typical for a large bus in a city with a population of 100–200 thousands (taken from our practice).
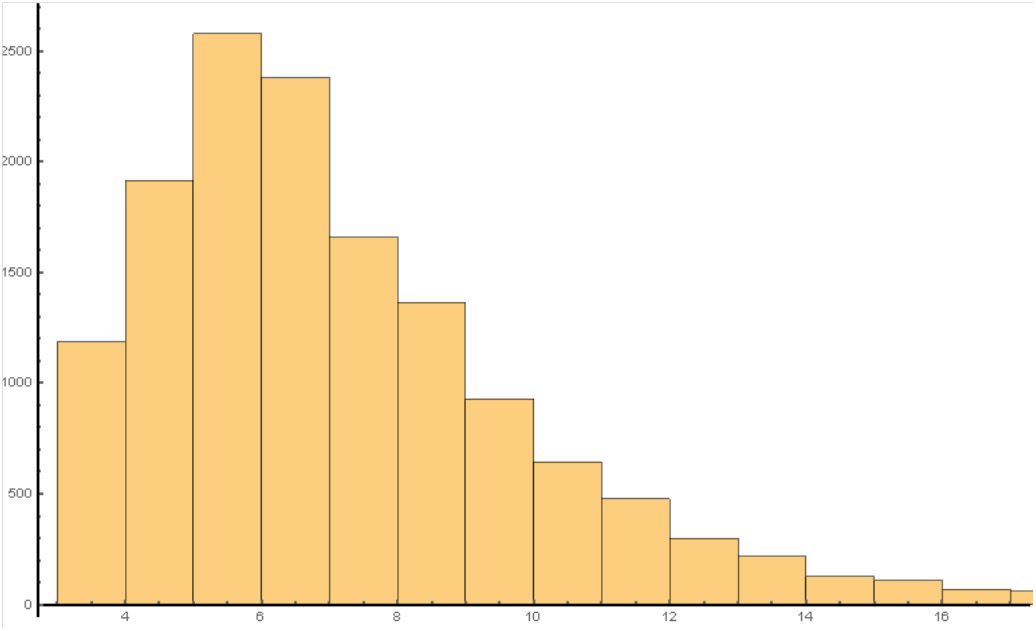
Рисунок 2
It can be seen that the basic parameters of distribution coincide with the typical parameters in assessment of a conductor's productivity. So, we can say by including fraud in the simulation, we can try to determine distribution characteristics that fraud is affects. As such characteristics, let's take the simplest ones - the average time and median time between transactions. From general considerations, it is clear when fraud increases, these times will increase too. Because fraud excludes from consideration certain cash transactions that are usually faster than non-cash transactions. And the simulation confirms this consideration. Here are some numbers (for typical modeling):
Average time
without fraud
6.997
Average time
With 10% fraud
7.724
Median time
without fraud
6.000
Median time
With 10% fraud
6.000
The table shows that the average time in the fraud situation has increased and, moreover, in the case of fraud, the difference between the average and median time has significantly increased. These metrics can be tried to use for determination of conductors with the largest percentage of fraud.
In the future, it is necessary to get rid of a number of limitations of the model in order to more correctly describe the distribution of time between transactions (for example, it is necessary to achieve manifestation of a peak at small times) to clarify and expand the studied metrics.