22 November 2020
Assessment of fraud among conductors, in absolute terms, is hampered by the fact, that we actually don't known which conductor is honest and which is not. However, we can try to compare two conductors by some criteria and tell which of them is more honest. At the first sight it seems that we need to compare a work of a conductors under completely identical conditions (same trip, same driver and, ideally, also same day of the week). Then the difference in some still unknown criteria will depend only on a conductor's personality.
However, by some reflection, we had a quite simple idea - the differential characteristics of a conductor’s work (based not on a number of transactions for a whole trip, but on an intervals between nearby transactions) don't depend on a driver and other factors. They are determined only by a conductor's movement speed and a speed of his work with a terminal, how quickly and precisely a conductor tears a ticket, how rarely he or she makes mistakes with the duration of attachment contactless card to a terminal, it shows if transaction by this card will be sucefully or this card have to be attached again, etc.
As such defining characteristics, we decided to take the simplest statistical parameters - the average time between nearby transactions, the minimum time between transactions, and the median time between transactions. In the future, we will add more complex criteria. Thus, the main data series where we extract the information is the series of time intervals between successive transactions of a given conductor, which is easily obtained from the array of transaction times for this conduct
However, it's clear, that this series must be prepared for work. It initially includes, for example, the intervals between a transactions of a last person with a ticket from a previous stop and a first one, who will enter on a next one. For example, if there were few people at a previous stop and a conductor quickly sells tickets for them, then she will rest until a next transaction, and of course this time would not tell anything about her work. And such large periods of time of course should be removed from the data series under study. So first we need to clusterize a time differences of consecutive transactions and select a desired data cluster. For our purposes, we choose the k-means clustering algorithm. Thus, the simplest study a conductor's performance includes the following steps:
- Select interest transactions from the database by criteria (by conductor, by driver, trip, etc.) and sort them by date and time.
- Make a series of time intervals between transactions.
- Clusterize resulting series and take a desired data cluster.
- Calculate a quantities of interest and build a histogram of resulting series.
Let's take a look on two typical distribution of time between nearby transactions, obtained for two conductors (Figure 1).
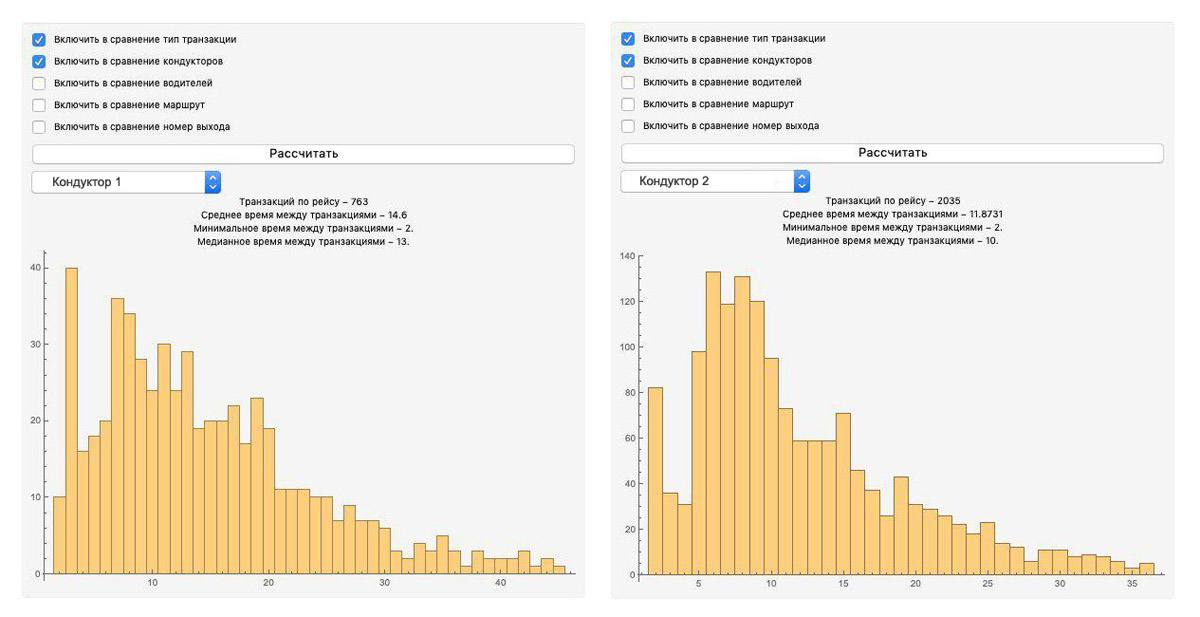
First of all, as we can see, that the distributions are similar to the Poisson distribution, but there are some differences. In particular, there is a clear surge in transactions with small time intervals between them. The reason of this surge are those transactions that the conductor performs almost one by one in the conditions when he's tightly surrounded by passengers. So, the presence and intensity of the burst may depend on how transport was loaded by passengers, in the selected consideration. The final interpretation and practical application of this method is still require further study.
But apart from the form of distribution, those calculated simple statistical indicators, in our opinion, speak a lot about the quality of the conductor’s work. Firstly, it's the average time between transactions - it's clear this value comprehensively estimates how quickly a conductor moves in a bus and how he's working with a card terminal. Secondly, the minimum time between transactions - this value estimates the clarity of work with a terminal, for example, such an important factor as how fast a conductor can tear off a ticket. Of course, this value itself is not very informative, which is well illustrated by the selected example. Both conductors have the same minimum time, however, on the histogram can be seen that a conductor on the right diagram have much more times close to the minimum value, it means this conductior is much faster with a terminal. The third indicator, the median time between transactions, also helps to estimate conductor's movement speed in a bus.
Indeed, there will always be people who entered the wrong door and conductor forced to move around a bus in order to sell them a ticket. The faster it happens, the less time passes between nearby transactions and the smaller the median of the number intervals between nearby transactions.
Ofcourse, all these calculations (especially such simple ones) are estimates and need more complex criteria and in-depth studies (including more statistics) in order to understand which the differences in parameters are important for manager. Bit even such a simple selection of parameters can reveal at least a most lagging behind in productivity employee.