22 November 2020
The formation of a comfortable urban environment is impossible to imagine without convenient public transport, which is one of the most important elements of smart city. Most of municipalities are actively discussing the problem of increasing travel by public transport, but how to achieve real results?
The relevance of this work is due to the following points:
- The urban transport infrastructure usually based on outdated regulations;
- It doesn't take into account the rapid increase of personal transport;
- Doesn't take into account changes in the functional purpose of urban spaces;
- The deterioration of the transport situation;
- Decreasing of a transport service quality;
- Traffic jams became bigger;
- Dissatisfaction of residents.
To achieve improvement in the performance of an urban transport network, it is necessary to apply new methods in developing a route network.
To achieve this goal, we need to complete a following tasks:
- Collecting, analyzing and converting a large amount of disparate, impersonal geo-distributed data on the movement of residents in an urban environment.
- Identification of main patterns in data and construction of correspondence matrices, changing over time.
- Description of criteria for assessing the quality of an urban transport network in an automatic mode using modern approaches without involving a transport specialist.
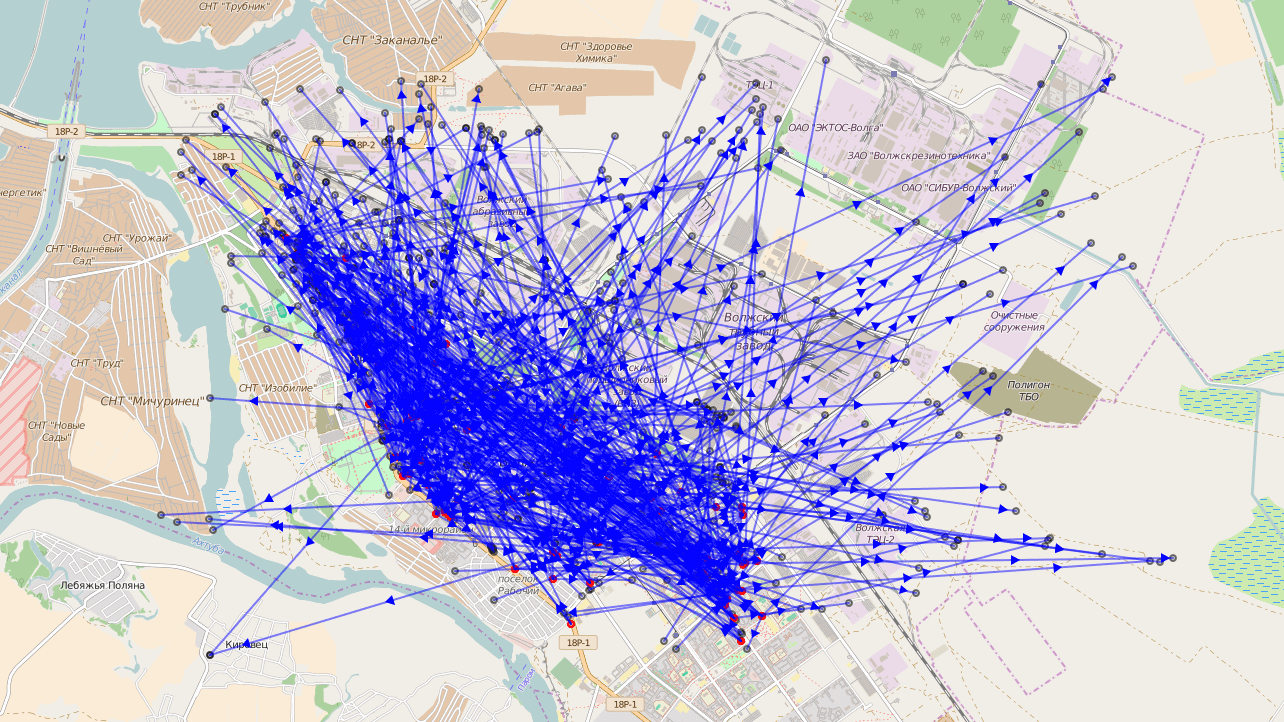
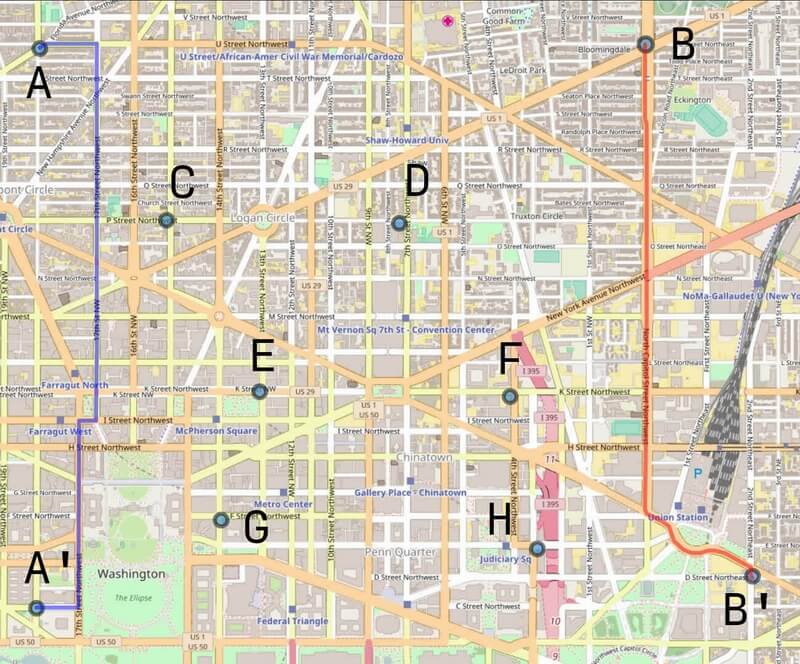
In order to achieve a real increase in the number of trips, it is usually required not only a complete reworking of an urban route network, but also a changes in an urban transport infrastructure, which is clearly coordinated with a route network. A striking example is a dedicated lane for public transport. On this route, we see sections of speed reduction up to 15 km/h, which is a critical indicator of speed for public transport.
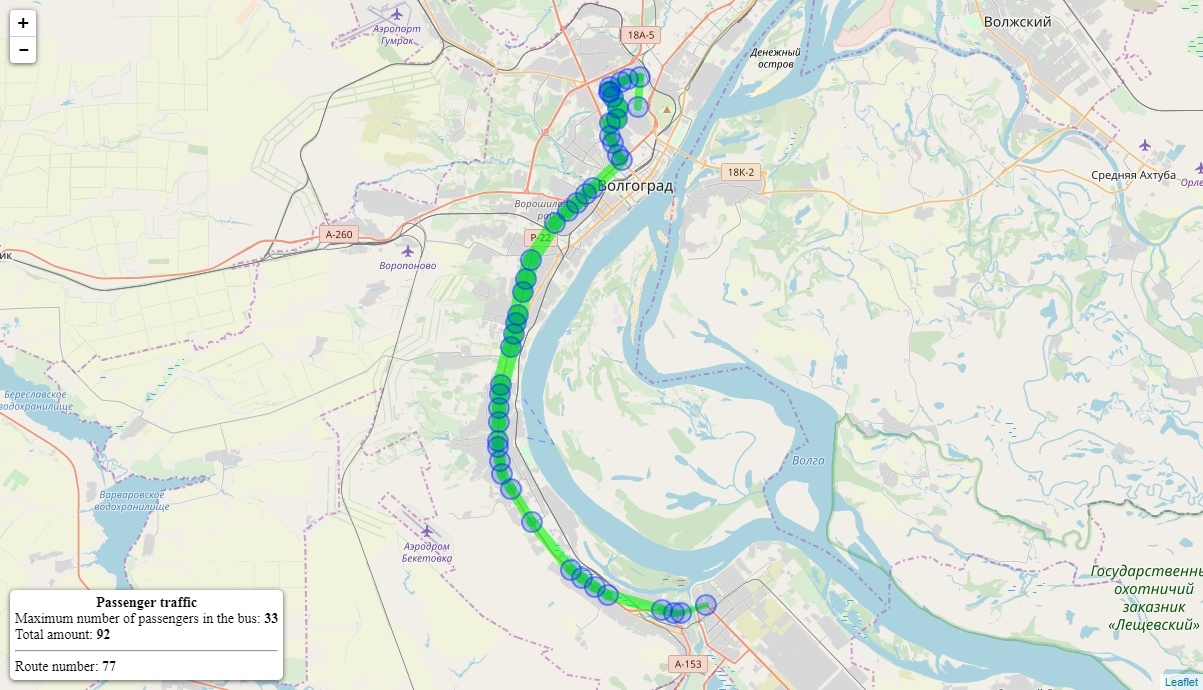
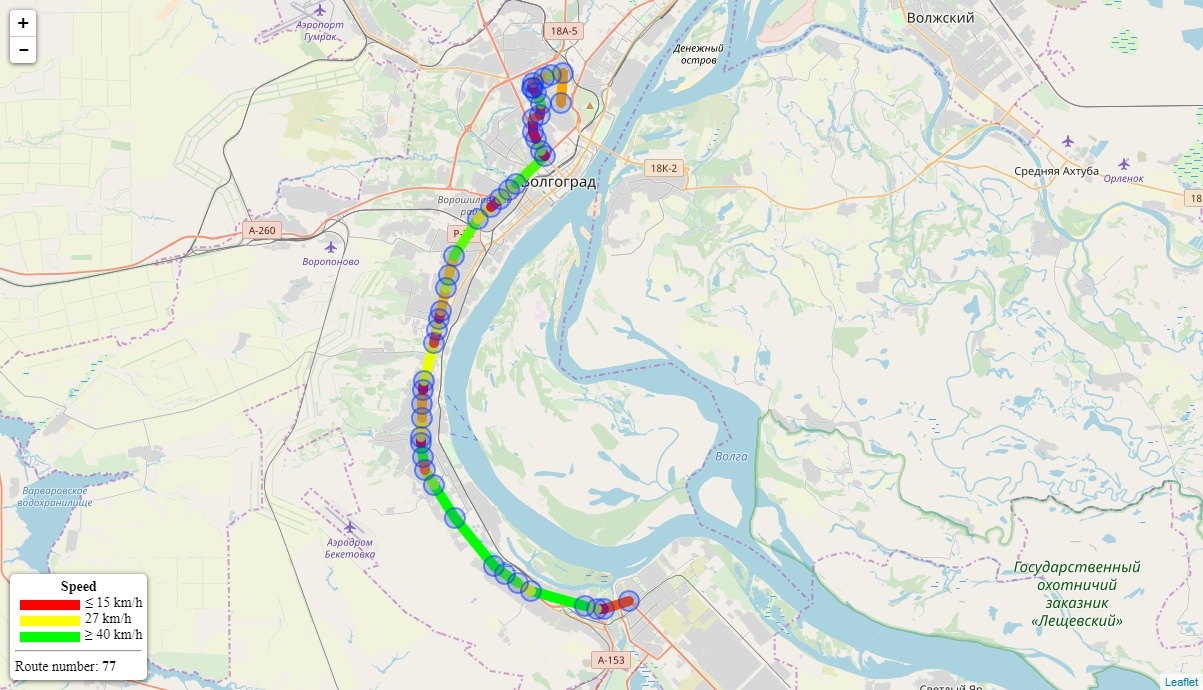
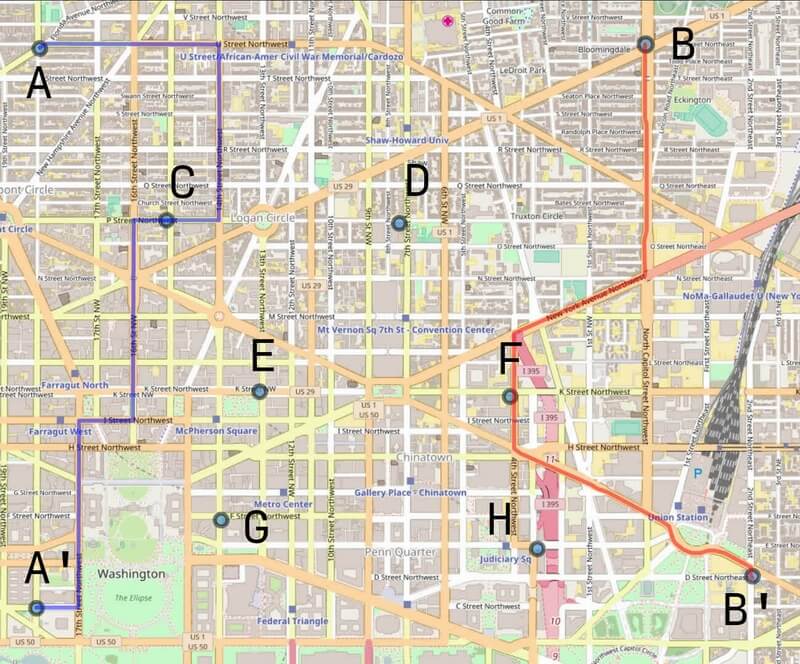
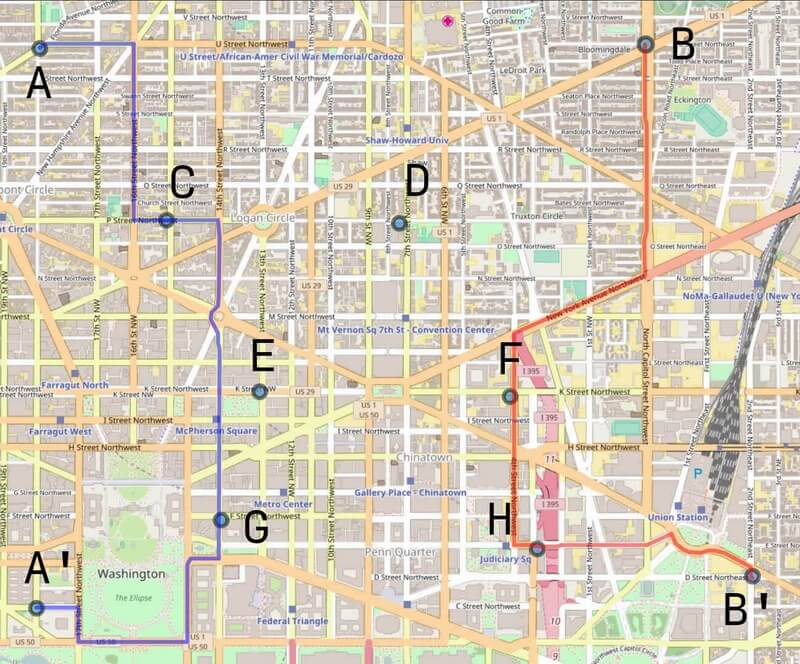
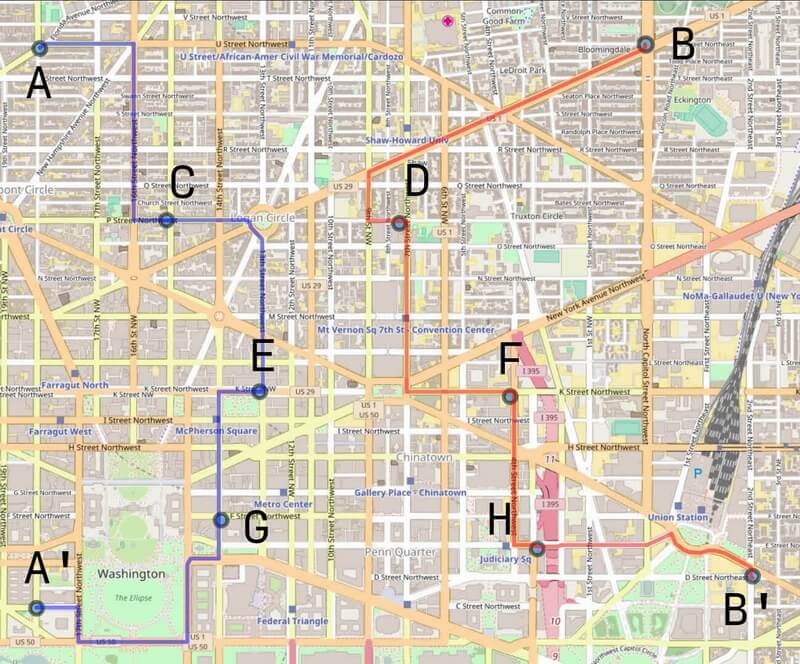
Route example – Volgograd, Russia.
Note that the route in this example has a sufficiently large length. Comfortable trips requires a large number of vehicles on a route, which reduces an overall profitability and does not improve a quality of travel.
One option is to build a more extensive route network, but it requires more transfers from passengers. However, the more number of transfers does not discourage passengers if it is not necessary to pay extra for it, and in the end, it will allow you to reach the end point faster than before.
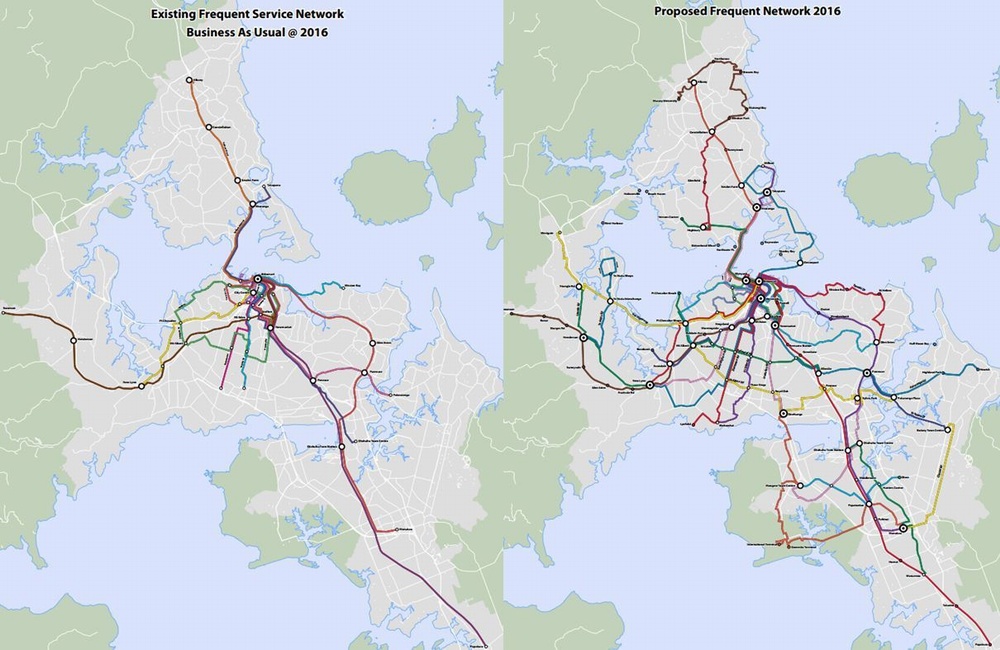
An example of a route network before and after - Oakland. The number of trips with transfers has doubled - now it is every sixth.
Operating expenses for an extensive route network are no higher than before, when there were fewer routes, but with a large number of buses. As in our example in Volgograd. It is important to remember that more efficient types of transport, such as subway or high-speed trams, are not always needed in cities - sometimes buses can completely replace them. They are inexpensive, flexible and don't require construction of significant infrastructure.
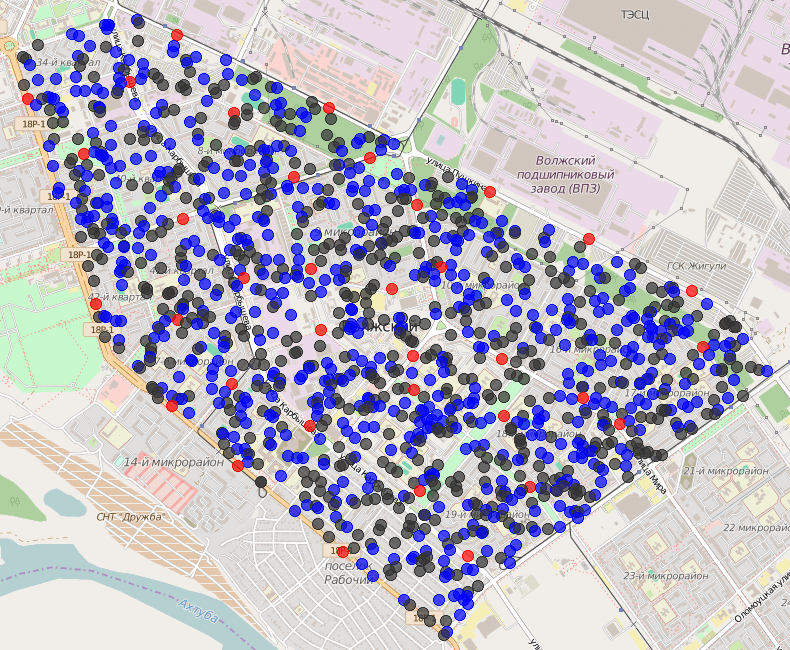
We have rather serious competences in the part of building route networks using modern technologies. To optimize a route network, it is necessary to analyze a large amount of data characterizing a size and mobility of population, an average time of movement, location residential areas and much more. For cities that using our cloud service JoinPAY Transport, we can very accurately build a new transport network, because the service accumulates a large array of data.
Let's take look at an example of our research. In this research, we will look at the task of improving public transport routes, primarily in terms of meeting transport demand.
1. Collection, analysis and conversion of data
- Using a data of mobile operators
- Data collection using online survey systems
- Social networks and microblogging
- GIS data services
- Statistical information
- Commercial Network Resources
2. Identify key patterns in data
- Clustering data using the K-means method (Euclidean metric, metric considering road network).
- Building a correspondence matrix

3. Criteria for assessing the quality of urban transport network
3.1. Degree of satisfaction of transport demand
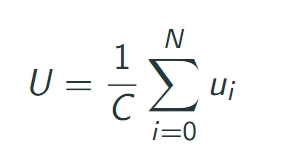
where U – degree of satisfaction of transport demand [0, 1];
N – maximum number of transfers;
ui – number of passengers transported with i transfers;
C – total number of passengers in need of transportation.
3.2. Non-straightness of a transport network
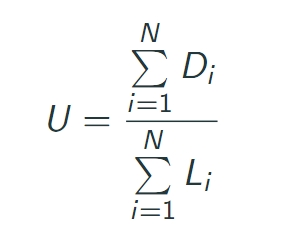
where, P – transport network non-straightness coefficient [0, 1];
N – number of routes in a transport system;
Li – length of i roune on the roads;
Di – distance from the beginning of i route to its end by air.
3.3. Density of a transport network
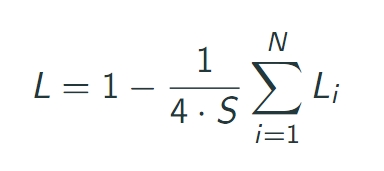
where, L – density of a transport network [0, 1];
N – number of routes in a transport system;
Li – leight of i route;
S – city area.
3.4. Integral assessment of a transport network
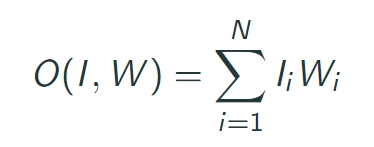
where, O – integral assessment of a transport network;
I – criteria values;
W – weights for criteria determining their importance;
N – number of criteria.
4. Algorithm for constructing the initial transport network
5. An example of the formation of a transport network
6. Methods of formation of a urban transport network
graph – building a route network without taking into account existing roads.
S. OSRM – single-stream version of building a route network taking into account existing roads.
P. OSRM – multi-stream version of building a route network taking into account existing roads.
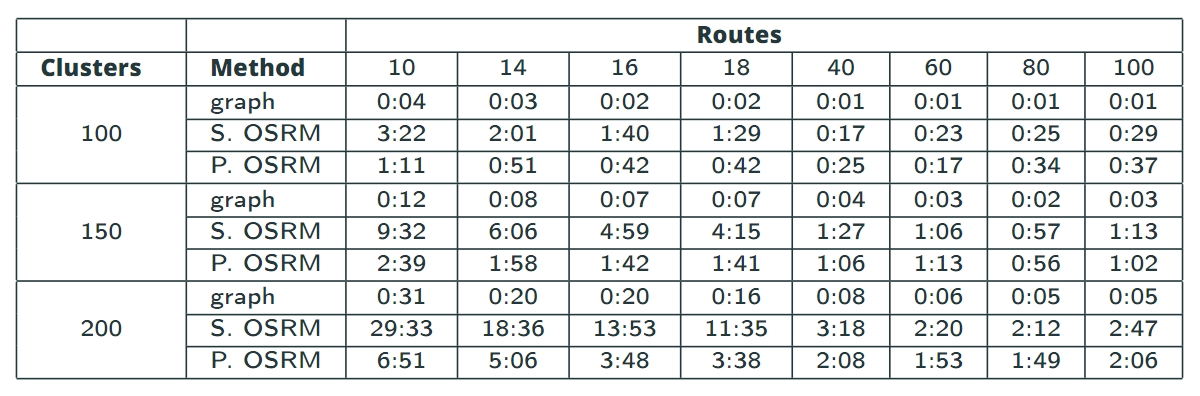
* Intel Core i5-3317U, 4GB RAM, Arch Linux, Python v3.5
7. Methods for selecting departure and destination points
Depending on a structure of urban environment, can be used the following methods of choosing points of departure and destination:
- «Opposite Clusters»
- «From center to outskirts»
- «N-focal points»
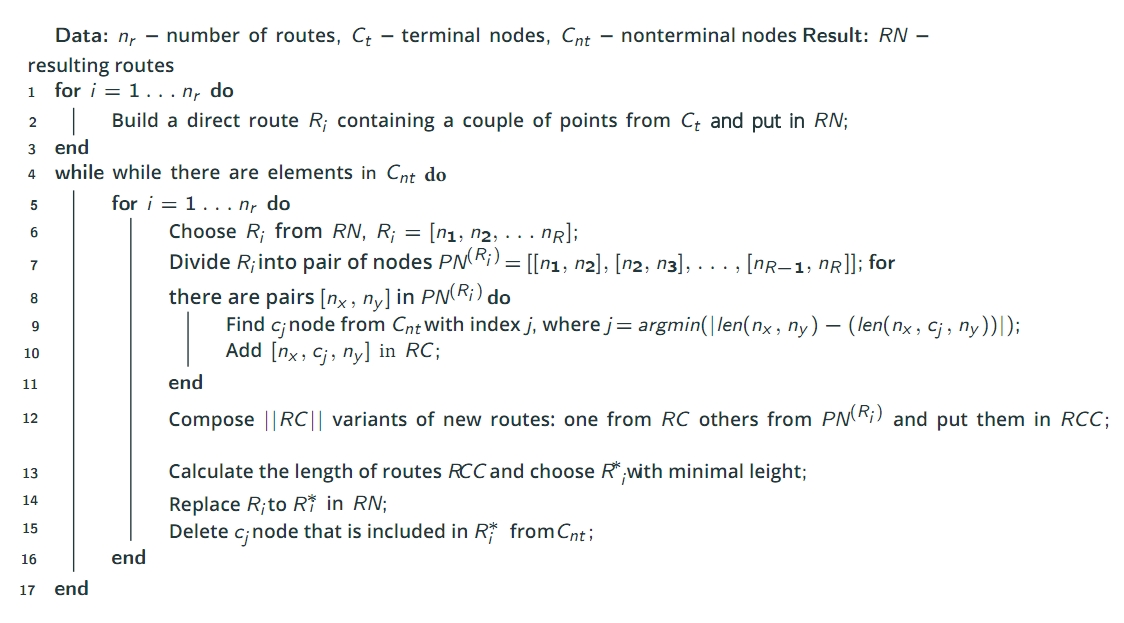
7.1. «Opposite Clusters» method
Input data: nr – number of routes, D – clusters.
Output data: Ct and Cnt – terminal and nonterminal clusters.
- Finding the convex hull formed by the D clusters.
- Finding the geometric center of C convex hull.
- Finding the farthest cluster from C center on the convex hull and consider it as the radius R.
- On the imaginary circle formed by R, marking evenly 2*nr points.
- We combine the diametral points in groups by two and put in Ct .
- Replacing remaining clusters from D to Cnt .
7.2. «From center to outskirts» method
Input data: nr – number of routes, D – clusters.
Output data: Ct and Cnt – terminal and nonterminal clusters.
- Finding the convex hull formed by the D clusters.
- Finding the geometric center of C convex hull.
- Finding the farthest cluster from C center on the convex hull and consider it as the radius R.
- On the imaginary circle formed by R marking evently nr points F.
- Finding the center of G city and choose nr clusters near G.
- Connecting clusters by pairs from G and F and put them into Ct .
- Placing remaining clusters from D into Cnt .
7.3. «N-focal points» method
Input data: N – number of focuses, KN – number of routes connecting N focus points, nr – number of routes, D – clusters.
Output: Ct and Cnt – terminal and nonterminal clusters.
- Finding the convex hull formed by the D clusters.
- Choosing N-focuses FN with the highest concentration of people.
- On a convex hull evenly nr - N*KN points of B.
- The first N*KN routes are laid between focal points and placed in Ct .
- The remaining points are distributed between B and FN and we placing them in Ct .
- The remaining clusters from D are placed in Cnt .
8. Results by methods
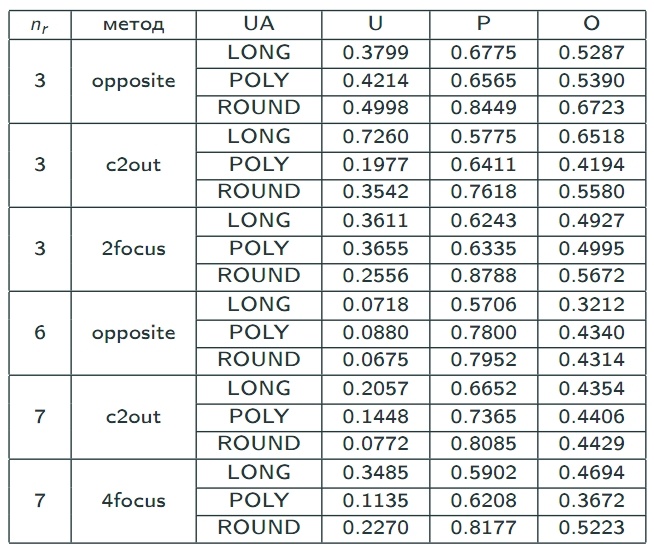
nr – number of routes in a transport network
opposite – «Opposite Clusters» method
c2out – «From center to outskirts» method
*focus – «N-focal point» method with different number of focal points
UA – city type
U – degree of satisfaction of transport demand
P – coefficient of non-straightness of a transport network
O – integral evaluation
9. Evaluation effectiveness of the developed algorithms
To assess the effectiveness of the developed algorithms, it's necessary to:
- Collect real data on the movement of residents in a city.
- Evaluate current transport network using described quality criteria..
- Build a new transport network.
- Evaluate a new transport network.
Conclusion
There are three areas for further work. First one is associated with the improvement of the proposed algorithms. Second - is about an integration of a developed applications with a collecting data sytems, regarding movements of residents through mobile operators. It will allows to quickly obtain real data in the required amount (at least 10% of a city’s population coverage). Third direction involves an integration of a developed software products into a single decision system.